Posts

Showing posts from April, 2024

M6: Isarithmic Mapping

Image
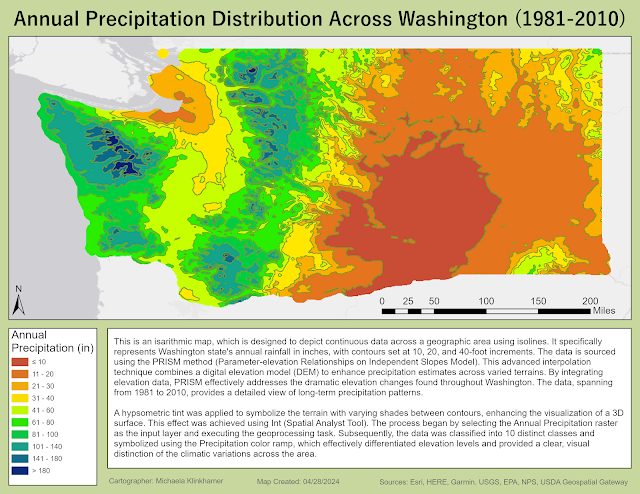
 Introduction and Overview of Isarithmic Mapping Assignment In this module, we delved into isarithmic mapping, focusing on its application in accurately representing continuous geographical phenomena. The primary objective was to create a detailed map that accurately depicts annual precipitation across Washington using the PRISM method. This approach is particularly effective in areas like Washington, where elevation significantly influences climatic conditions. The integration of a digital elevation model (DEM) with PRISM enhances the accuracy of climate data, which is crucial for areas with diverse topographies. Explanation of the Map The resulting map displays annual precipitation in Washington, leveraging data from the PRISM model. This model adjusts precipitation estimates by incorporating elevation data from a DEM, revealing how terrain impacts weather patterns. The map serves as a powerful tool for visualizing and analyzing precipitation distribution, providing a detailed and ac

M5: Choropleth Maps

Image
Introduction and Objectives In our latest lab assignment, we embarked on a journey to create a thematic map that visually represents data across different geographical units. The assignment involved producing a choropleth map highlighting population densities in European countries, supplemented with proportional or graduated symbols indicating wine consumption levels. The primary objective was to utilize visual representation to make complex data more accessible and interpretable. Thematic Techniques and Classification Schemes Choropleth maps are a staple in the cartographer's toolkit, using color to represent the intensity of data across predefined areas. For our map, population density was the selected metric. We opted for graduated colors to ensure a clear distinction between areas with varying population densities. The classification method used was Natural Breaks (Jenks), which is particularly effective for data with significant variances as it reduces variance within classes

M4: Data Classification

Image
 Mapping the Ages: Understanding Miami Dade's Senior Demographics Introduction & Overview In this week's lab assignment, we dove into the demographics of Miami-Dade County, focusing on the senior citizen population. The objective of the assignment is to apply and analyze four different data classification methods using ArcGIS Pro to visualize and understand the distribution of the population over 65 in Miami Dade County based on the Census data. Classification Methods Explored The exploration involved four distinct classification methods: Equal Interval: Dividing data into equal ranges highlighted uniform data distribution, but it potentially masked the subtleties of clustered populations. Quantile: By distributing an equal number of tracts into each class, this method showcased how tracts compared to each other but at the cost of concealing the true range of values. Standard Deviation: Focusing on deviations from the mean, this method emphasized areas with unusual concen

M3 Lab: Cartographic Design

Image
  Introduction & Overview This week's lab assignment involved creating a map of public schools in Ward 7, Washington D.C., using Gestalt's Principles. We needed to use design principles that not only help convey information but do so in an immediately intuitive way to the viewer. This involves careful consideration of color, contrast, figure-ground distinction, map space and scale, and selective inclusion and exclusion in our cartographic design.  Applying Gestalt’s Principles Visual Hierarchy: Use symbol sizes and colors to differentiate between school levels, ensuring that the most important features catch the viewer’s attention first. Contrast: Choose a color palette that allows features to stand out while maintaining a coherent overall design. Avoid too many contrasting colors, which can clutter the visual field and detract from the map's legibility. Figure-Ground: Make Ward 7 the focal point by using a lighter color than the surrounding areas. This will draw the v