GIS 5007L - Computer Cartography - M6: Isarithmic Mapping
Introduction and Overview of Isarithmic Mapping Assignment
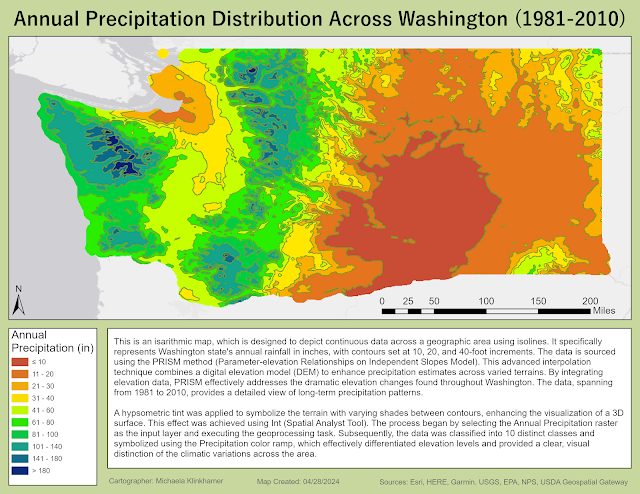
In this module, we delved into isarithmic mapping, focusing on its application in accurately representing continuous geographical phenomena. The primary objective was to create a detailed map that accurately depicts annual precipitation across Washington using the PRISM method. This approach is particularly effective in areas like Washington, where elevation significantly influences climatic conditions. The integration of a digital elevation model (DEM) with PRISM enhances the accuracy of climate data, which is crucial for areas with diverse topographies.
Explanation of the Map
The resulting map displays annual precipitation in Washington, leveraging data from the PRISM model. This model adjusts precipitation estimates by incorporating elevation data from a DEM, revealing how terrain impacts weather patterns. The map serves as a powerful tool for visualizing and analyzing precipitation distribution, providing a detailed and accurate resource.
Key Points and Map Applications
Key Points:
Elevation Influence: The map vividly shows changes in precipitation with elevation, crucial for understanding climate behavior.
Data Visualization: Employing hypsometric tints and hillshade effects, the map offers a 3D-like view that enhances spatial understanding.
Accuracy and Detail: The combination of PRISM and ArcGIS ensures high accuracy and detail, capturing subtle climate variations.
Map Applications:
Agricultural Planning: This map is invaluable for farmers planning crop types and irrigation based on expected water availability.
Water Resource Management: It aids hydrologists in managing water catchment and distribution.
Environmental Research: Researchers use the map to study ecological zones and the impacts of climate change.
Urban Planning: This is useful for planning infrastructure based on precipitation trends, with an eye on flood risks and water drainage.
This isarithmic map is not only an educational tool but also a practical resource for professionals in various sectors, illustrating the power of visual data in conveying complex climatic information.


Comments
Post a Comment