Posts

Showing posts from September, 2024

GIS5935 M2.1 Surfaces - TINs and DEMs

Image
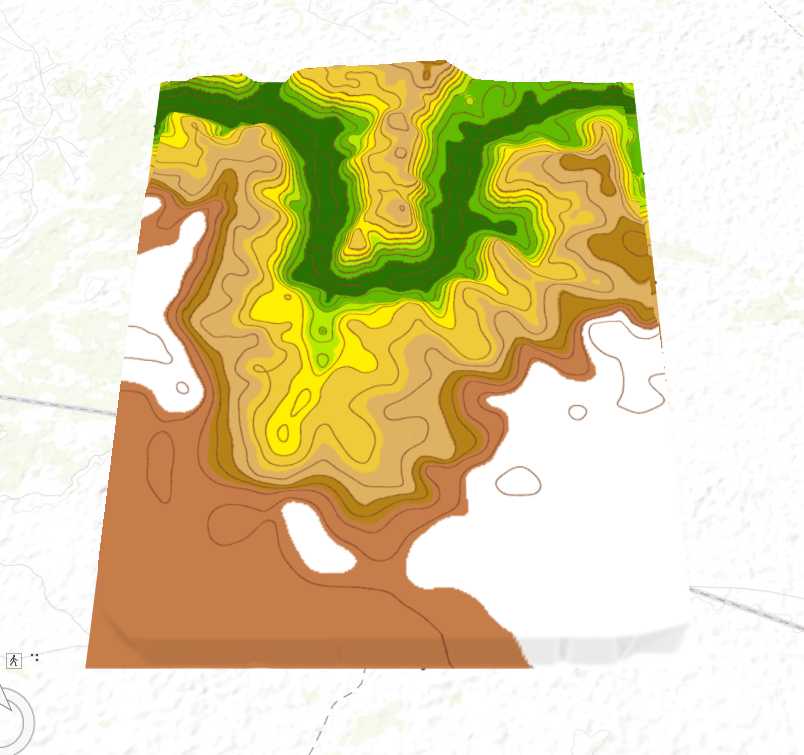
In my exploration of elevation data models, I examined both Triangulated Irregular Networks (TINs) and Digital Elevation Models (DEMs) to understand their unique properties and applications. TINs are formed by connecting data points into triangles, providing highly detailed but angular representations of terrain. On the other hand, DEMs are grid-based and create smoother surface representations through interpolation techniques. I compared these models by analyzing contour lines generated from both TIN and DEM data. One key difference I found is that DEM contours are much smoother, especially in flatter areas with less elevation variation, while TIN contours are more angular, especially in areas of steeper terrain due to the triangular structure. The smoother DEM is more suitable for continuous surface representation, while the TIN excels in areas requiring more detailed elevation information. A comparison between DEM and TIN contours can be seen below: DEM TIN This exploration highligh

GIS5935 M1.2 Data Quality Assessment

Image
 Accuracy Assessment of Road Network Completeness Goal of the Accuracy Assessment This accuracy assessment aims to compare the completeness of two road network datasets: Street_Centerlines and TIGER_Roads shapefiles for Jackson County, Oregon. The objective of evaluating the total length of roads within a uniform 5km x 5km grid is to determine which dataset provides more comprehensive coverage for the area. This analysis allows for identifying areas where one dataset may be more detailed than the other, contributing to a better understanding of road network quality in the region. Analysis Methodology The analysis methodology involved multiple steps to compare the two road networks. First, the road datasets— Street_Centerlines.shp and TIGER_Roads.shp —were clipped to the boundaries of a 5km x 5km grid that spans Jackson County. The Clip  tool ensured that the roads outside the grid cells were removed. The next step used the Intersect tool to divide road segments at the grid boundaries

GIS5935 M1.2 Lab Data Standards

Image
  Assessing Positional Accuracy of Road Networks: A Case Study In this project, I conducted an accuracy assessment of road networks using data from the city of Albuquerque and StreetMap USA. The goal was to determine the positional accuracy of the two datasets, following the methodology outlined by the National Standard for Spatial Data Accuracy (NSSDA).  Below is a screenshot of the test point locations for the data from the city of Albuquerque: Steps Taken to Complete the Accuracy Assessment: Data Exploration : I began by exploring both datasets, comparing road centerlines from the City of Albuquerque and StreetMap USA against orthophotos of the area to check for differences. Selection of Test Points : Using NSSDA guidelines, I selected 20 well-defined points, such as road intersections, that were visible in both datasets and the reference orthophotos. Independent Dataset : The orthophotos were treated as the independent reference data due to their high level of accuracy. Coordinate