M1 - Crime Analysis
Crime Hotspot Analysis in Chicago
Brief Description of Analysis Steps
Grid-Based Thematic Mapping:
- Performed a spatial join between the grid cells and totalhomicides_2017.
- Created a new feature class homicide_grid.
- Selected grid cells with a homicide count greater than zero and exported them to homicide_count.
- Selected the top 20% of grid cells with the highest counts (62 out of 311) and exported to hom_top20per.
- Created an integer field DISSOLVE and assigned a value of 1.
- Dissolved hom_top20per into a single polygon hom_top20per_diss.
Kernel Density for Homicides:
- Ran the Kernel Density tool with:
- Input Point Features: totalhomicides_2017
- Output Raster: homicides_kd.tif
- Output Cell Size: 100 feet
- Search Radius: 2630 feet
- Area Units: Square miles
- Output Cell Values: Densities
- Method: Planar
- Reclassified the raster to select values above three times the mean density (mean = 2.88, threshold = 8.64) and converted it to a polygon hom_kd.
Local Moran's I for Homicides:
- Performed a spatial join between census tracts and totalhomicides_2017, resulting in hom_morans_sj.
- Added a float field for crime rate and calculated the homicide rate per 1000 housing units.
- Ran Local Moran's I tool with:
- Input Feature Class: hom_morans_sj
- Input Field: Calculated crime rate
- Output Feature Class: hom_morans_run
- Selected high-high clusters and exported to hom_morans_hh.
- Dissolved hom_morans_hh by the COType IDW field.
Results
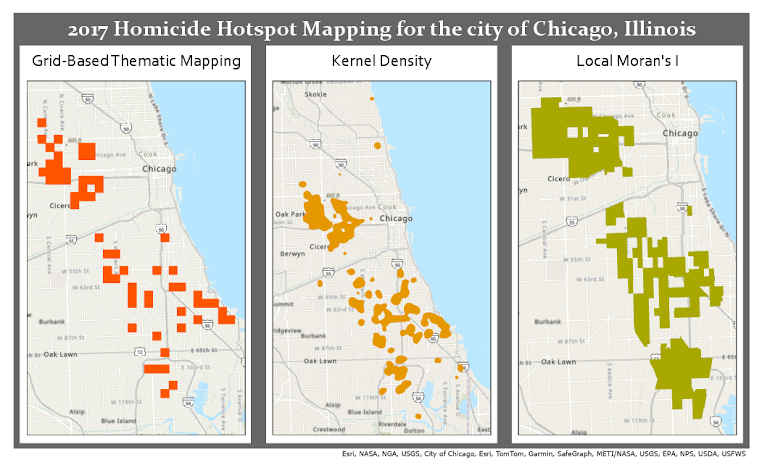
Each hotspot map provides unique insights into the spatial distribution of homicides in Chicago:
- Grid-Based Thematic Mapping: Offers a straightforward visualization of high-crime grid cells. It's useful for identifying general areas with high homicide counts, though it may lack detailed spatial variation within the cells.
- Kernel Density: Produces a smooth surface that reveals broader patterns of crime concentration. This method is excellent for visualizing overall crime density but can miss smaller, high-density clusters.
- Local Moran’s I: Identifies statistically significant clusters of high crime rates. This method is powerful for pinpointing specific high-risk areas, making it highly effective for targeted law enforcement interventions.
Conclusion
Among the three methods, Local Moran’s I stands out for its ability to identify precise clusters of high crime rates, making it a powerful tool for focused law enforcement efforts. Each method, however, provides valuable insights that can be tailored to the specific needs of the analysis. Combining these approaches can lead to a comprehensive understanding of crime patterns, facilitating more informed and effective policing strategies.


Comments
Post a Comment